This blog will be the first of several on the topic of resource adequacy; the ability of supply and demand-side resources to meet electricity system demand and losses. Resource adequacy is a particularly hot topic in industry right now due to the importance of reliably meeting demand in an era of extreme load growth and installation of renewables, and it is of particular interest to industry meteorologists as supply and demand become increasingly weather-dependent. Dr. Justin Sharp, one of my mentors in the Portland energy industry and a University of Washington atmospheric science graduate, illustrates this increasing weather-dependency very well with the below graphic. Justin’s presentation was one of several at the ESIG 2024 Forecasting & Markets Workshop – a link to all presentations is here.
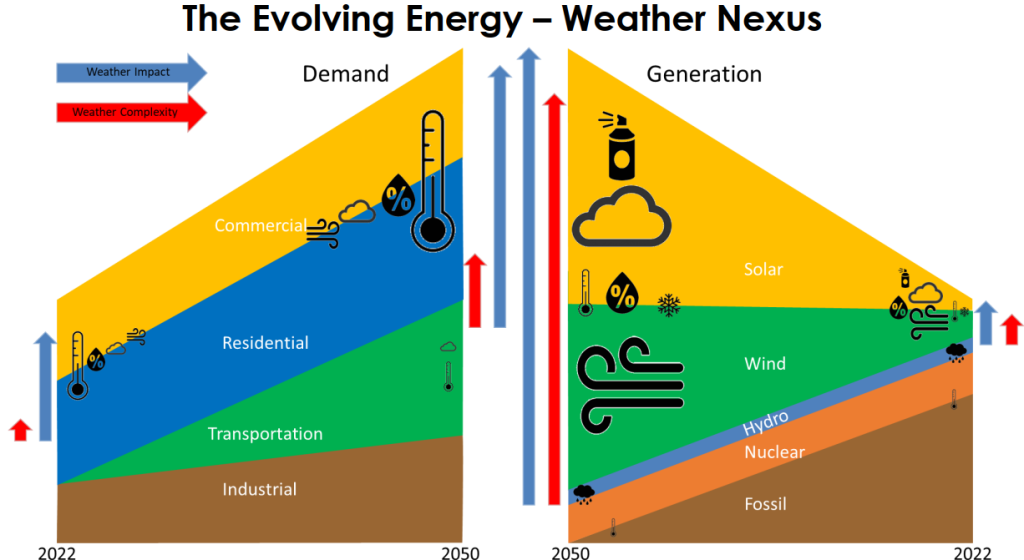
This blog will first discuss electric system reliability and the two subsets of reliability: security and adequacy, as well as stability – a broad subset of security. I’ll then give examples of failures for both: the 2003 Northeast Blackout for security, and the Texas 2021 Blackout for adequacy. Finally, I’ll discuss the deep relationship between adequacy, energy markets, and meteorology using actual market data from the 2021 Texas Blackout and the broader concepts of locational marginal pricing and the supply stack to show how high demand during extreme weather events directly leads to high wholesale electricity prices. Though I will give an overview of some of the key metrics for measuring resource adequacy (LOLE, LOLP, EUE/EENS, ELCC, PRM), I’ll discuss resource adequacy in much greater detail in future blogs.
Electric System Reliability
Resource adequacy is a subset of the broader topic of electric system reliability. A reliable power system is one that can continuously deliver power to customers in the face of equipment failures, grid instability, and other, “normal” issues experienced by the bulk electric power system (BPS). The BPS refers to the combination of electric generation and transmission infrastructure across North America, but it does not cover low-voltage distribution infrastructure that is responsible for delivering electricity to homes and businesses. The BPS is normally considered to include voltage levels of 69 kV and above, and the North American Electric Reliability Corporation (NERC) provides explicit definitions of a reliable power system via their reliability standards. These standards are approved by the Federal Energy Regulatory Commission (FERC) and are enforceable in all interconnected regions of the United States (including ERCOT, which, as a state entity, is not under FERC jurisdiction).
NERC divides reliability into two categories: security and adequacy. Security addresses the ability of the grid to survive system disturbances/faults. Security covers natural disturbances such as short circuits and the unanticipated loss of system elements and human-made hazards like physical and cyberattacks, and both steady-state and dynamic assessments are used to model security. Adequacy ensures that the grid has enough energy to serve load at the proper voltage and frequency via a combination of generation, transmission, storage, energy-efficiency, and demand response programs. Maintaining adequacy requires system planners and operators to account for scheduled and reasonably expected unscheduled outages of equipment, and the adequacy of a system is characterized probabilistically. Adequacy assessments are based on steady-state models only.
Stability is a subset of security. The main distinction between security and stability is that stability solely refers to the ability of the operating system to maintain operating equilibrium after a disturbance, while security addresses all other aspects of system performance. For example, two systems may have equal stability margins, but one may do so at a greater risk of overloading equipment or resulting in voltage violations. The below image shows the different types of power system stability within the bulk power system

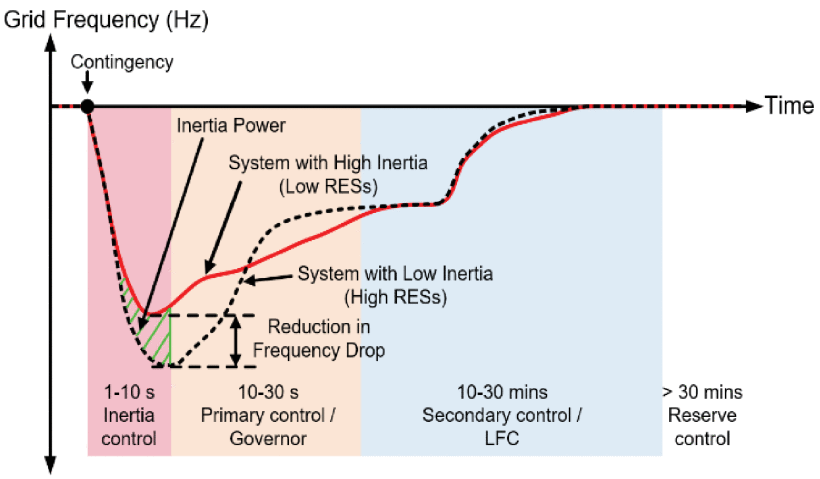
Stability is negatively impacted by the increase in inverter-based resources such as wind and solar and decommissioning of large thermal or hydroelectric facilities. This is because the heavy, grid-synchronized turbines in thermal/hydroelectric plants are able to maintain rotor angle stability through system faults due to the large momentum of the spinning turbines. The displacement of these synchronous generators by inverter-based resources results in less voltage/frequency stability due to faster changes in total energy production (example: a cloud passing over a solar farm) and places more torque on the turbines due to larger differences and more rapid changes in grid frequency relative to that of the turbine. The below image is retrieved from Kerdphol et al. (2019) and shows that grid frequency drops after a system contingency in both high-inertia and low-inertia systems, but the drop is ‘deeper’ in a system with low inertia (and high renewable energy sources, or RES).
Resource Adequacy
Resource adequacy refers to the ability of the bulk electric system to meet demand at any given time, including losses. Historically, resource adequacy has consisted primarily of supply-side resources, but there are now an increasing number of demand-response programs that allow grid operators to increase or decrease the aggregate demand on the electric grid.
There are several commonly-used metrics to quantify resource adequacy. The most commonly-used metric is the Loss-of-Load-Expectation (LOLE), which refers to the number of time units where demand will exceed supply. Both SPP and MISO use a LOLE threshold of “1 day in 10 years,” and this is the industry standard for expansion planning. LOLE is often used interchangeably with Loss-Of-Load Probability (LOLP), which expresses the percentage risk of the loss-of-load over a given time.
The LOLE threshold is commonly used to derive the Planning Reserve Margin (PRM). The planning reserve margin is expressed as a percentage of the total available capacity relative to the peak demand. For example, a planning reserve margin of 15% means that there is a total capacity 15% greater than the expected peak demand. It is a best practice to derive the planning reserve margin from the LOLE because some generators have higher forced outage rates than others. In other words, one system with a planning reserve margin of 15%, but a higher rate of forced outages, would be less reliable than a system with a planning reserve margin of 15% and fewer forced outages. However, a 2011 NERC report also postulated that the planning reserve margin may become less important – or even obsolete – as dispatchable generation is removed from the grid and replaced with renewable generation.
The LOLE does not consider the magnitude of the supply shortfall – only the frequency at which it is expected to occur over a given time period. The magnitude of the shortfall is given by the Expected Unserved Energy (EUE) also called Expected Energy Not Served (EENS). Unlike LOLE, there is not an “industry standard” value for EUE. EUE may become more valuable as renewable generation sources displace fossil fuel generation and the grid becomes more weather-dependent and vulnerable to periods of low renewable generation.
Finally, another important resource adequacy concept is the Effective Load Carrying Capacity (ELCC). The ELCC measures the contribution of a generator or group of generators toward reducing the LOLE over a given period. For example, solar farms located in an area where peak solar generation aligns perfectly with peak loads would have a high ELCC, but if the solar generation was reduced during peak loads or the farms were located in an area where peak load and solar generation were not perfectly aligned, the solar farms would have a lesser contribution toward reducing LOLE and thus a lower ELCC. For wind/solar siting purposes, it is important to balance ELCC with other metrics like capacity factor so that plants can not only produce high average generation throughout the year but generate when it is most needed.
Historically, resource adequacy has focused on generation alone and assumes transmission capacity is infinite. However, due to the increasing penetration of variable energy resources (VERs) like wind and solar and the increasing importance/prevalence of interregional transmission (especially high-voltage, direct-current (HVDC) transmission), there is a push toward including HVDC in resource adequacy assessments. This approach has primarily stayed in the research sphere as of now and has not gained widespread adoption in industry, but we may find that existing utility and RTO resource adequacy frameworks will become obsolete in the coming decade(s) as the electricity system undergoes a paradigm shift from localized, dispatchable (coal, natural gas, etc.) generation to decentralized, wind/solar generation connected by extensive transmission. I plan to focus on this in future blogs.
Energy Security/Stability Failure – 2003 Northeast Blackout
There is an incredible amount of engineering that goes into maintaining a reliable electric system, but for all of its complexity, a reliable electric system is something we all take for granted. But on those rare occasions when things do go wrong, the consequences can be catastrophic. An example of a failure in security was during the Great Northeast Blackout of 2003. The Great Northeast Blackout was caused when a line sagged onto a tree branch during hot weather and caused an outage, but due to a few generator outages earlier in the day, power system software had an inaccurate view of the system, and this outage went unnoticed.
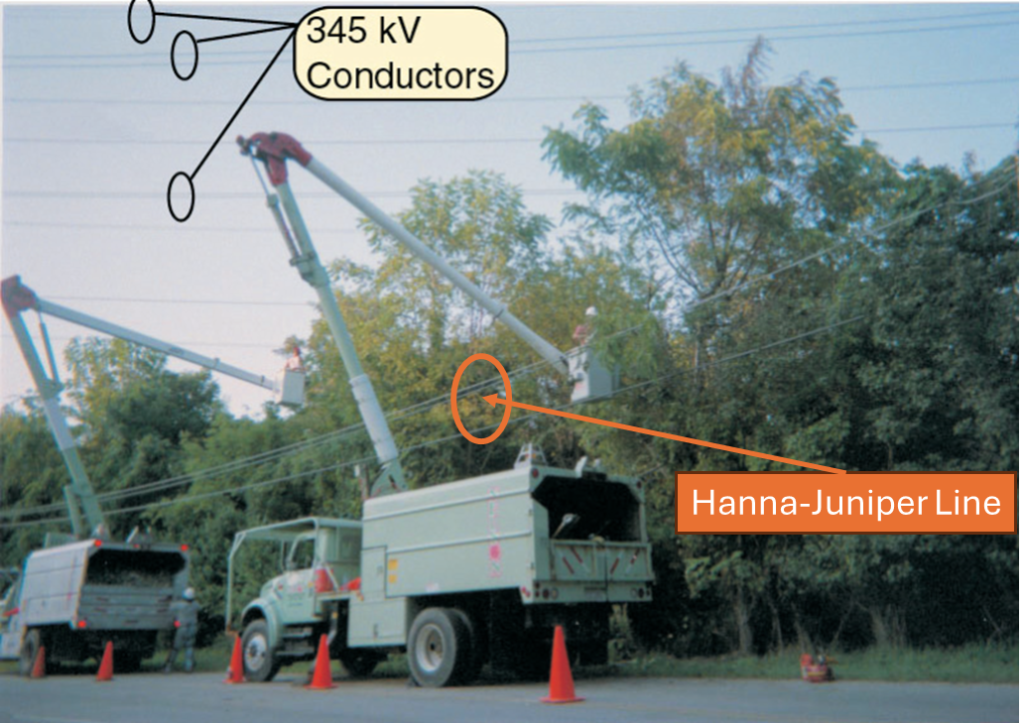
Credit: Nelson Tree
Without action by electric grid operators to correct the outage, strong oscillations in voltages and currents caused neighboring transmission lines to trip offline, and with each transmission line that tripped, higher currents and stronger oscillations were redirected to neighboring lines, creating a dangerous positive feedback loop known as a “cascading outage.” Additionally, the frequency of the bulk electric system, which is supposed to remain at 60 Hertz, dropped across the grid and plants tripped offline to protect themselves from this dip in frequency. As plants tripped offline, frequency dropped even more due to the decrease in supply, and even more plants tripped offline, causing cascading outages of generation facilities as well.
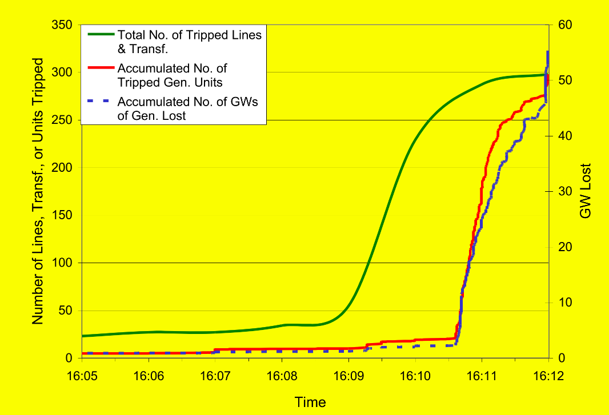
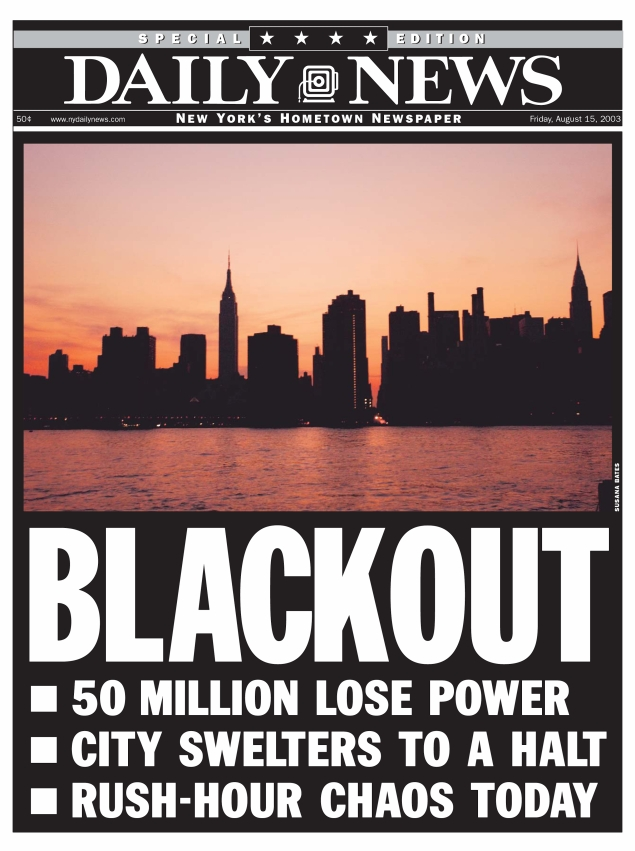
Within minutes, 50 million people in the Northeast lost power, including nearly all of New York City. The Great Northeast Blackout was an example of a catastrophic collapse in energy security.
Energy Adequacy Failure – February 2021 Texas Blackout
The Continental U.S. has not seen such a widespread blackout since the 2003 Northeast Blackout, but many will recall the catastrophic Texas blackout of February 2021. While the Northeast blackout was caused by a software bug, the Texas blackout was caused by the record-breaking cold and electricity demand over Plains and Texas during Mid-February.
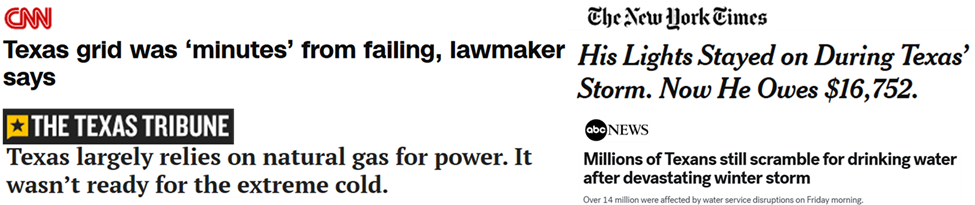
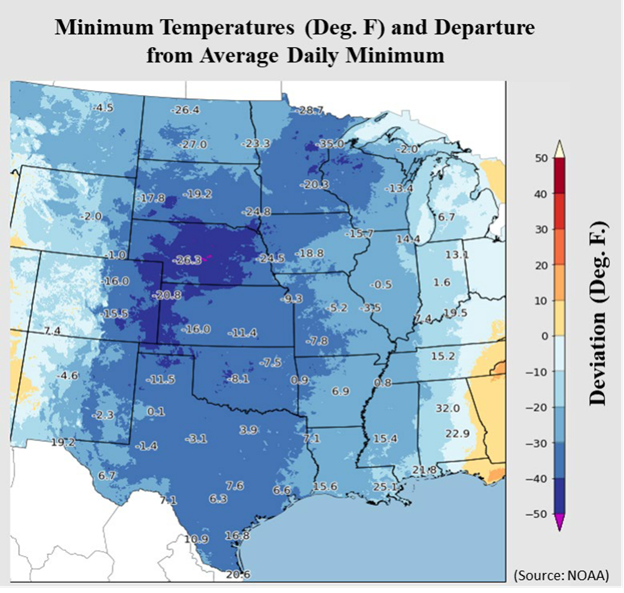
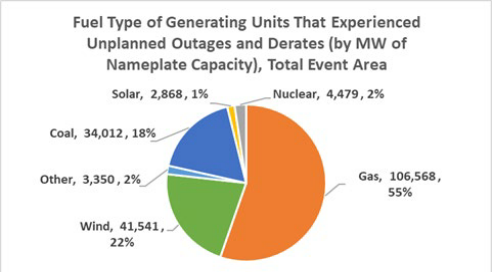
At the time, electric and natural gas infrastructure was not winterized, causing massive unplanned generator outages due to two main issues: Generator malfunctions, where frozen instrumentation for thermal generators (mainly natural gas), wind turbine blade icing saw cold weather-related faults, and fuel supply issues, where natural gas wellheads froze and gas compression/pipeline systems lost power or had cold-weather faults. All of this occurred during a period of record winter load, meaning there was extreme demand, a limited number of generators available to serve demand, and the gas generators that could run were extremely expensive due to natural gas supply shortages and record-high natural gas prices. Additionally, because Texas (ERCOT) operates as a standalone grid, there was very little energy available to import into the state.
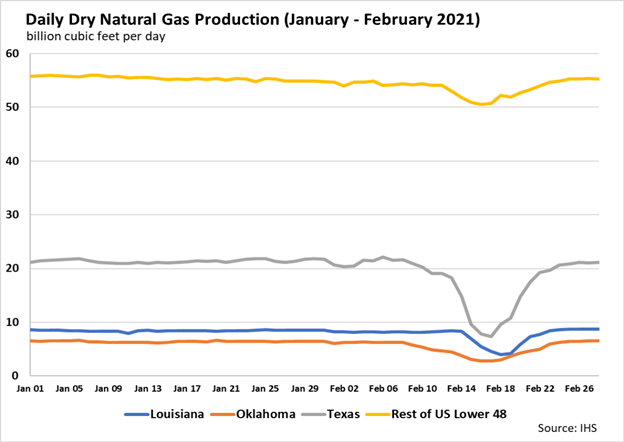
Total U.S. dry gas production fell from 90.8 Bcf/d on 2/4 to 65.4 Bcf/d on 2/17; a 28% decline! The largest declines occurred over the Permian Basin (West Texas), Eagle Ford Shale (South Texas), Anadarko Basin (OK/TX Panhandle), and Haynesville Shale (East Texas/NW Louisiana).
Rolling outages, primarily over ERCOT, were issued to maintain frequency and prevent cascading outages, like what happened in 2003. ERCOT saw 3 days of outages with a peak of 20,000 MW, the Southwest Power Pool (SPP) saw 5 hours of outages with a peak of 2,700 MW, and the Midcontinent ISO saw 2 hours with a 700 MW peak. In all, the 11 million citizens (4.5 million customers) without power, there were 80-130 billion dollars in economic losses, multiple utilities went bankrupt, and there were at least 246 deaths.
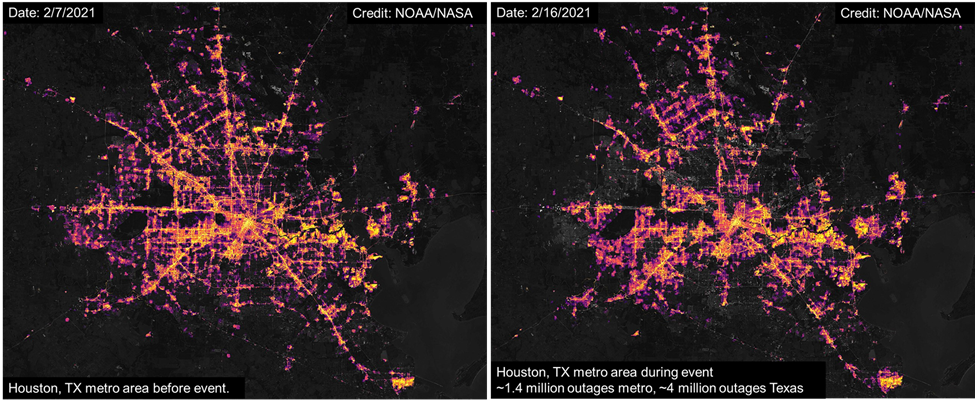
The Houston metro area alone saw 1.4 million outages. The below satellite images demonstrate “normal” operating conditions before the event vs. the massive outages during the event.
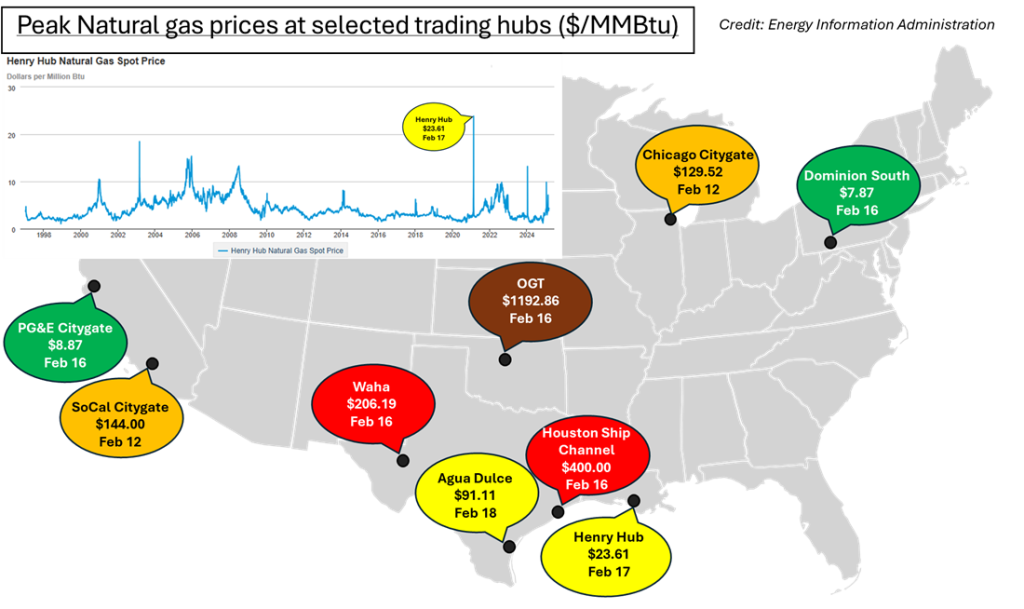
The collapse in gas supply resulted in dramatic price surges due to utilities being forced to buy physical natural gas in the spot market to meet customer demand. Note the large discrepancy in regional gas prices below due to different supply regions for gas and some hubs being more “liquid” than others. Oneok Gas Transmission (OGT) saw the highest price of any hub on record (1192.86/MMBtu). Even Henry Hub, the most liquid natural gas trading hub in the world and the only one directly traded on the New York Mercantile Exchange (NYMEX), saw prices reach 23.61/MMBtu, the highest levels in history.
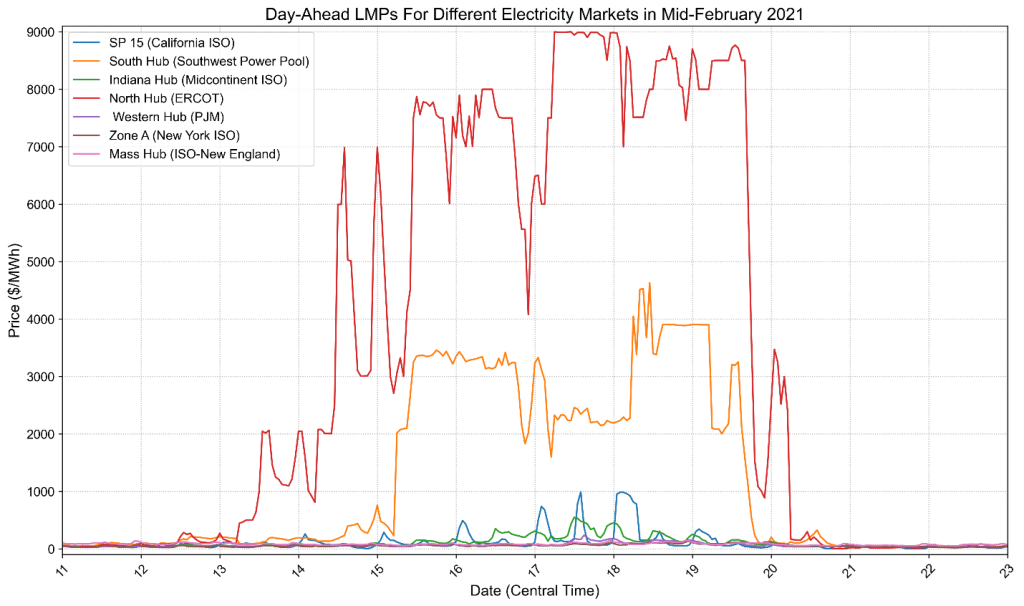
The extreme gas prices, combined with extreme loads, caused price caps to be reached at ERCOT, SPP, and southern parts of MISO and CAISO. Meanwhile, Central California north to the Pacific Northwest, and the I-95 corridor on the East Coast, remained relatively cheap due to the much more moderate gas prices and demand. Because customers in ERCOT have the option (but are not required to) have retail rates that are equivalent to wholesale market rates, those who maintained power throughout the storm who did not fully understand the consequences of being exposed to the electricity spot market were hit with astronomical electricity bills during the event, with many accumulating $10,000 in costs over a single week.
Since the February 2021 winter storm, there has been a major push toward better generator winterization, emergency response plans, and gas-electric sector coordination. The Federal Energy Regulatory Commission (FERC) issued Orders 896 and 897, collectively known as the “Reliability Orders.” 896 was titled “Transmission System Planning Performance Requirements for Extreme Weather” and directed NERC to design new transmission planning standards for extreme temperatures. In response, NERC created TPL-008, which establishes performance requirements for the transmission system during extreme temperature events. Order 897 directed each Regional Transmission Operator (RTO) to submit a ‘one-time informational report’ to FERC describing their extreme weather vulnerability assessment processes. NERC collectively issued their “Cold Weather Reliability Standards” after the storm. Specifically, these were EOP-011-4 (emergency operations), TOP-002-5 (operations planning), and EOP-012-2 (extreme cold weather preparedness and operations). And, as previously mentioned, they later developed and issued TPL-008 in response to FERC Order 896. Finally, ERCOT, which, as a single-state entity, is not subject to FERC jurisdiction, created new winterization rules for generators, lowered their price caps from 9000/MWh to 5000/MWh, and reformed their governance structure. Hopefully at some point, ERCOT will interconnect to the Western or Eastern Interconnections so that it can import and export power, but these are steps in the right direction toward increasing cold weather resilience.
Adequacy, Locational Marginal Pricing, and the Supply Stack
The wholesale, day-ahead/real-time markets use locational marginal pricing (LMPs) to represent the cost of delivering the last (or “marginal”) megawatt of electricity to serve demand at a specific point, or “node,” on the grid. The LMP has three components: the marginal cost of energy, the marginal cost of losses, and the marginal cost of congestion. The marginal cost of energy is equivalent to the market clearing price created when matching all of the electricity “supply” and electricity “demand” bids into this market, and it is the same for all nodes. The marginal cost of losses is found by modeling actual power losses over transmission lines. And the marginal cost of congestion is the difference between the system-wide marginal cost of energy (SMEC) and the “actual” marginal cost of energy at that node due to transmission constraints. I have a more detailed blog on LMPs here, and my Ph.D. advisor, Dr. Jim McCalley, has a more thorough and technical description here (see class number 20).
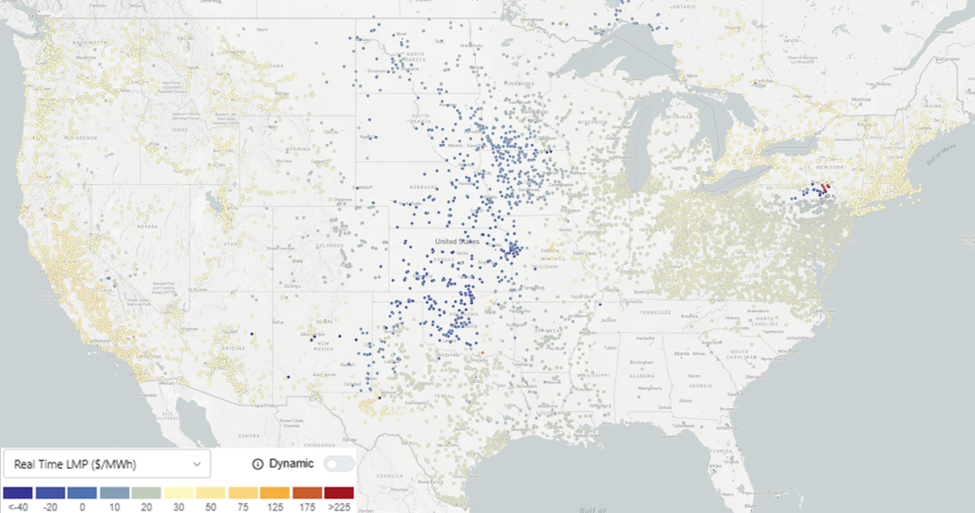
LMPs are correlated with weather patterns, fuel prices, outages, & grid topology. The graphic below shows the LMPs in the real-time markets across the U.S. at 2am CDT 7/28. Prices are relatively low due to low demand, and congestion is low due to both low demand and renewables, resulting in fewer energy import/export constraints. The lower prices over the Plains are due to higher wind and lower demand, and the sharp divide in prices near the New York/Pennsylvania border is due to congestion, likely due to a transmission line outage or generator outage.
During periods of extreme load, nearly all generators are dispatched, resulting in an extreme marginal cost of energy, and by extension, extreme LMPs. This is illustrated by the “supply stack” below, which plots generators in the order they are dispatched, given ‘typical’ fuel prices. Electricity prices increase further when gas prices are high, generators experience outages, and there is little/no energy to import from neighboring regions. All three occurred in ERCOT during the February 2021 storm.

From a meteorology perspective, LMPs illustrate the weather-dependency of electricity prices on the grid at any given point, while the supply stack represents just how high electricity prices can surge when there are energy adequacy issues and every last generator is dispatched to meet load. The ties between electricity markets, meteorology, and energy adequacy run very deep, and it is not surprising that many power traders and energy meteorologists are very interested in adequacy.
Thanks for reading, and stay tuned for future blogs where I will discuss how resource adequacy has historically been defined, how it is currently practiced in industry, and how it must change in response to new technologies.